
This week’s technical outlook focuses on the continued strength of the US Dollar Index (DXY) and the resulting opportunities in major currency pairs. Our analysis utilizes 4-hour timeframes, focusing on Fair Value Gaps (FVG) and liquidity pools to identify high-probability trade setups.
The general theme for the week ahead is waiting for price corrections into “premium” or “discount” zones before rejoining the prevailing trends.
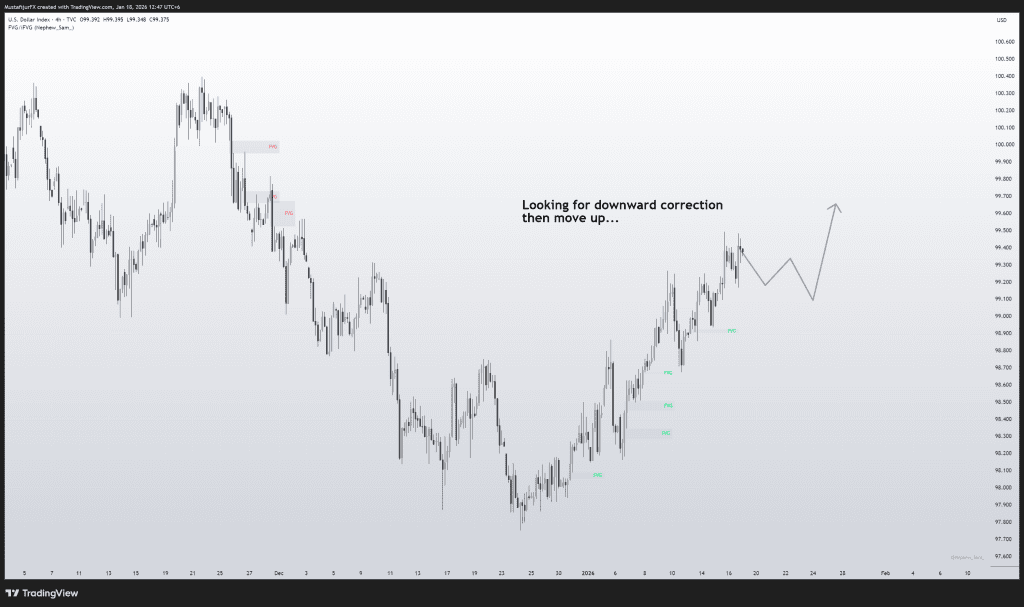
Chart Analysis performed on TradingView/Deriv. You can find my full charting setup in my Toolkit
US Dollar Index (DXY) – Bullish Bias
The DXY has established a strong bullish trend. Currently, we are seeing a minor pullback from recent highs.
The Setup: We are not looking to chase price at these highs. Instead, we are patiently waiting for a downward correction. Our area of interest lies below current price action, where several unmitigated bullish Fair Value Gaps (green zones) reside.
Outlook: We anticipate price will dip into these discount zones to collect orders. Once price taps into these FVGs, we expect bullish momentum to resume, driving the index upward toward new highs.
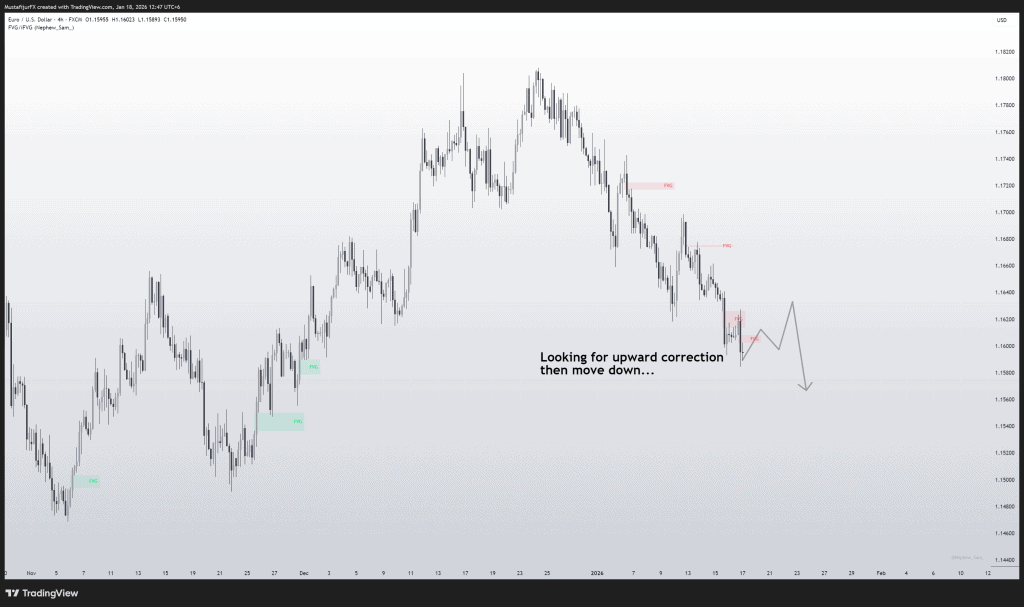
Chart Analysis performed on TradingView/Deriv. You can find my full charting setup in my Toolkit
EURUSD – Bearish Bias
Inverse to the DXY, the Euro shows a clear bearish structure. The pair has recently moved away from its lows and is currently in a retracement phase.
The Setup: The current upward movement is viewed as a correction within a larger downtrend. We are monitoring bearish Fair Value Gaps (red zones) located above the current price located in premium pricing areas.
Outlook: We are looking for price to rally into these bearish FVGs. We expect sellers to step in at these levels, capping the correction and pushing the pair down to test previous lows and potentially lower liquidity objectives.
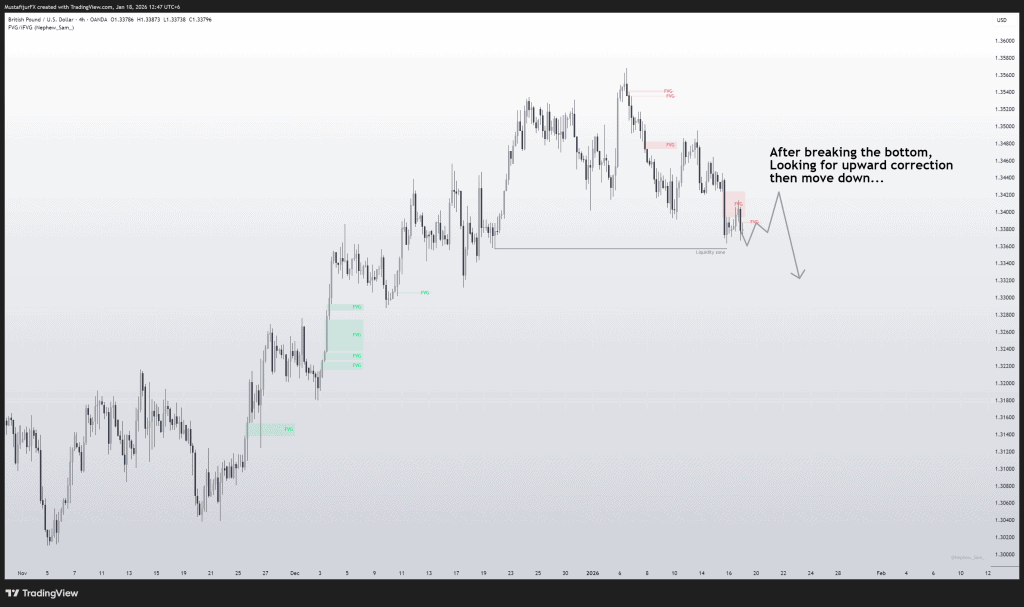
Chart Analysis performed on TradingView/Deriv. You can find my full charting setup in my Toolkit
GBPUSD – Bearish Bias (Post-Liquidity Sweep)
GBPUSD presents a similar bearish picture to EURUSD but with a key structural development already in play.
The Setup: The pair has recently swept a significant sell-side liquidity zone (breaking previous structural lows). Often, a liquidity sweep is followed by a counter-trend retracement before the primary trend resumes.
Outlook: Following this break of the bottom, we are now looking for an upward correction. Our target for this retracement is the bearish FVG located above. Once price mitigates this area, we anticipate a continuation of the downward move.
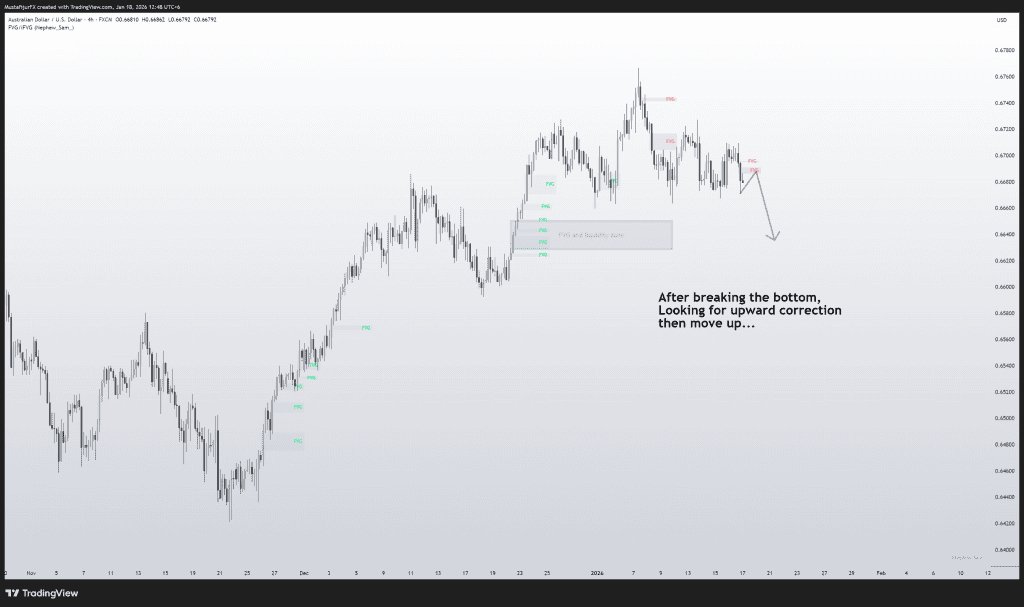
Chart Analysis performed on TradingView/Deriv. You can find my full charting setup in my Toolkit
AUDUSD – Bearish Bias (Targeting Major Liquidity)
The Australian Dollar remains under heavy selling pressure. The chart highlights a significant area of interest below the current price action.
The Setup: Price is approaching a major “FVG and liquidity zone” to the downside. The immediate plan involves waiting for the market to attack these lows.
Outlook: We are looking for price to break the current bottom and tap into the large liquidity/FVG zone marked on the chart. Similar to GBPUSD, once this sell-side liquidity is taken, we may see a temporary upward correction into premium zones before the bearish trend looks to continue further.
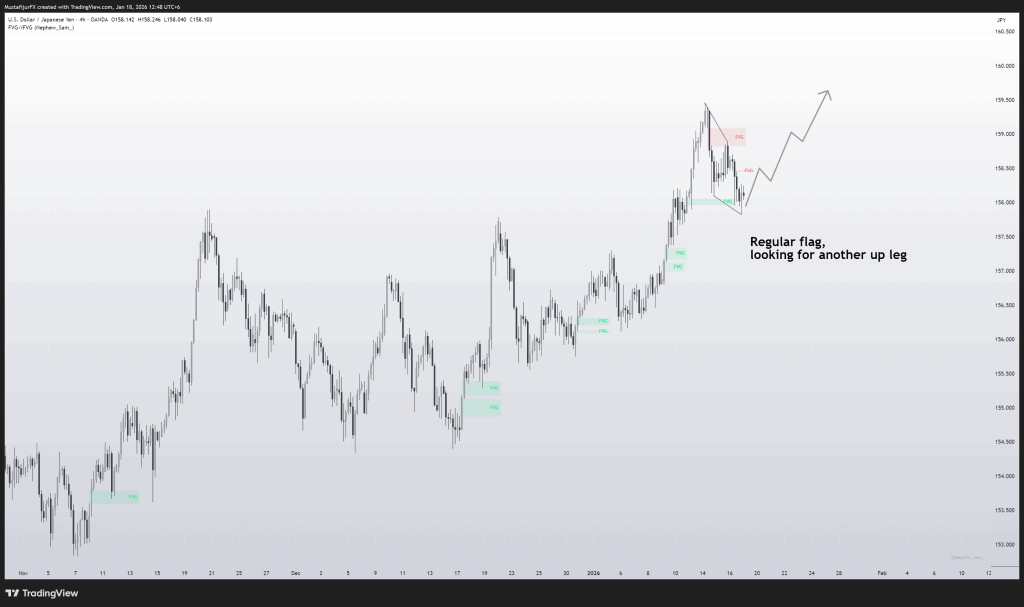
Chart Analysis performed on TradingView/Deriv. You can find my full charting setup in my Toolkit
USDJPY – Bullish Bias (Flag Continuation)
The USDJPY pair continues to show strength, aligning with our overall bullish outlook on the Dollar Index. The market structure remains clearly defined by higher highs and higher lows.
The Setup: Price has formed a “regular flag” pattern, which is a classic continuation setup in a trending market. We are currently observing a corrective phase that is consolidating recent gains.
Outlook: We are waiting for this consolidation to complete. The expectation is for price to break out of this flag structure and initiate another leg up. We are looking for price to respect the bullish order flow and target higher liquidity levels as the trend resumes.
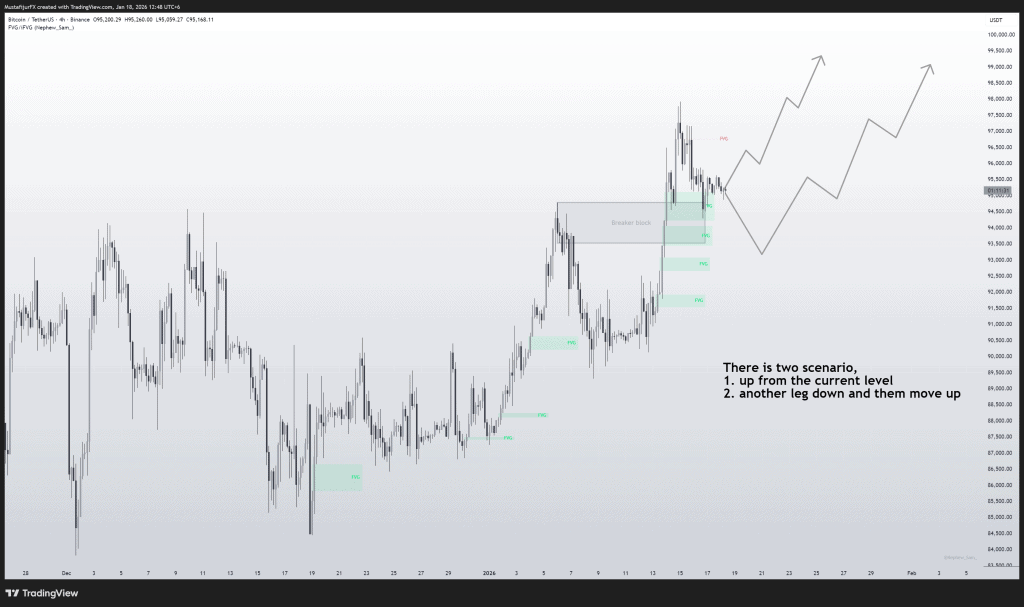
Chart Analysis performed on TradingView/Deriv. You can find my full charting setup in my Toolkit
Bitcoin (BTCUSDT) – Bullish Bias (Breaker Block Test)
Bitcoin remains in a strong uptrend. The chart highlights a key structural area—a “Breaker Block”—that is expected to act as dynamic support.
The Setup: We have identified a significant Breaker Block zone that aligns with bullish Fair Value Gaps (FVG). Price is currently reacting around this area.
Outlook: There are two high-probability scenarios we are monitoring:
- Immediate Continuation: Price finds sufficient demand at the current level and rallies straight up.
- Deep Correction: Price dips slightly lower to fully test the bottom of the Breaker Block/FVG zone before rejecting and moving higher. In either case, the bias remains strictly bullish.
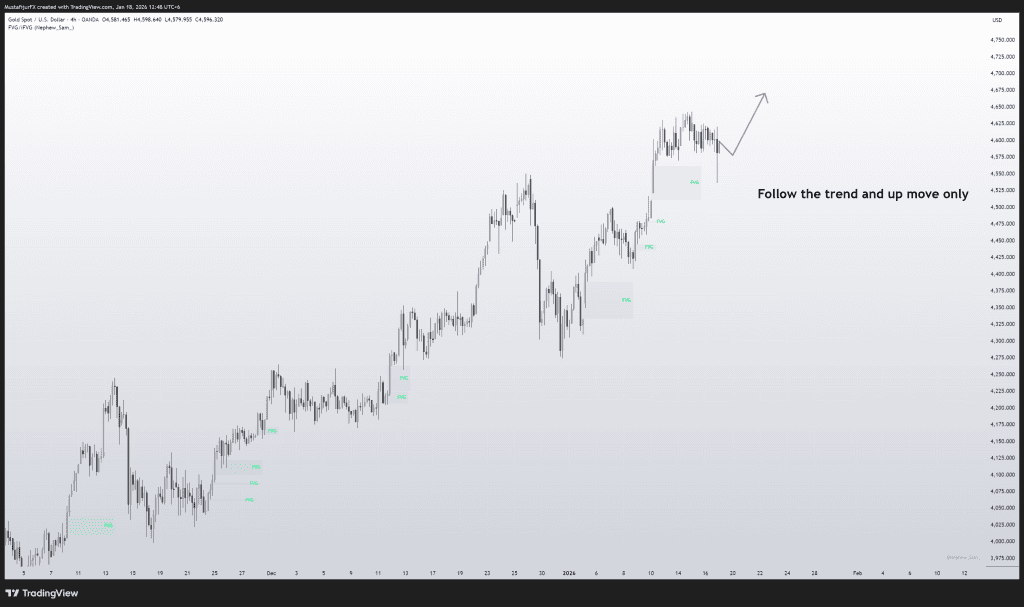
Chart Analysis performed on TradingView/Deriv. You can find my full charting setup in my Toolkit
Gold (XAUUSD) – Bullish Bias (Trend Following)
Gold is exhibiting a powerful bullish trend. The strategy here is simple: trend following. We are avoiding counter-trend short positions and focusing solely on joining the upward momentum.
The Setup: The market has left behind several unmitigated bullish FVGs (green zones) during its ascent. These zones represent areas where institutional buying pressure was strong.
Outlook: We are looking for “up moves only.” Any retracement into the nearest bullish FVG should be viewed as a potential buying opportunity. We anticipate the price will continue to respect these discount arrays and push toward new highs.
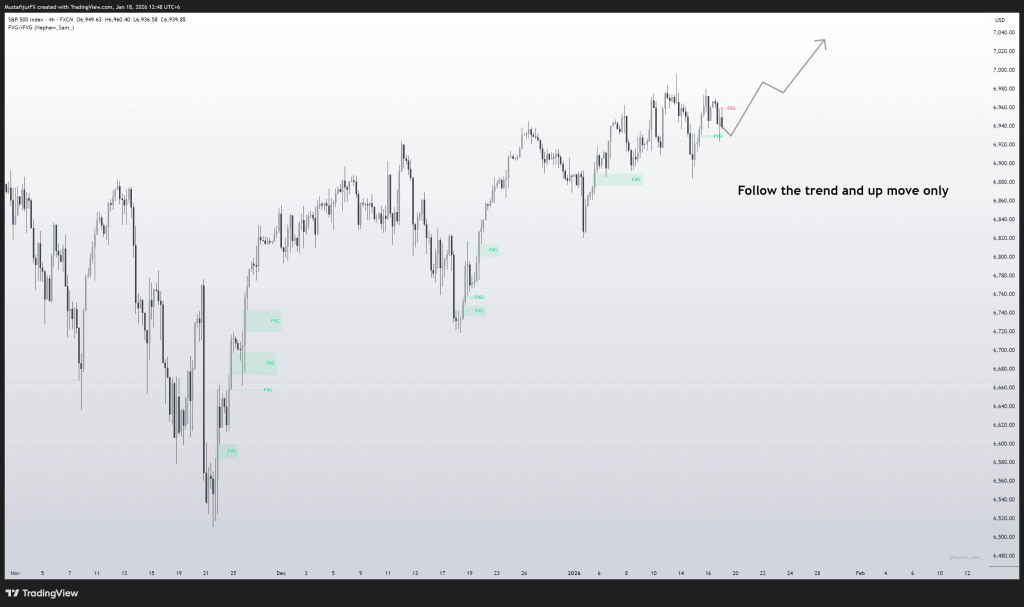
Chart Analysis performed on TradingView/Deriv. You can find my full charting setup in my Toolkit
S&P 500 (SPX500) – Bullish Bias
Similar to Gold, the S&P 500 index is in a confirmed uptrend. The price action suggests that bulls are fully in control, and we are looking to align ourselves with this dominant force.
The Setup: Price has consistently broken resistance levels and created new support zones. The chart shows multiple bullish FVGs below the current price, offering a “safety net” for any pullbacks.
Outlook: Our stance is to “follow the trend.” We are waiting for a minor correction or a pause in price action to offer an entry. Once the correction concludes, we expect the index to expand higher, continuing its bullish trajectory.
In summary, the market outlook for the week of January 19 – 23 is defined by a cohesive theme of USD strength and trend continuation across equities and crypto. We are observing a clear divergence where the DXY is poised to expand higher after a discount retracement, putting pressure on major pairs like EURUSD and GBPUSD. Meanwhile, Gold, Bitcoin, and the S&P 500 remain in strong structural uptrends, where our primary focus is buying dips at key support levels such as Breaker Blocks and Fair Value Gaps. As always, patience is key—wait for price to come to your specific levels of interest to ensure you are executing with the highest probability.
DISCLAIMER: FOR EDUCATIONAL PURPOSES ONLY
The information, analysis, and charts presented in this “Weekly Market Outlook” are strictly for educational and informational purposes only. They do not constitute financial advice, investment recommendations, or a signal to buy or sell any financial instrument.
Risk Warning: Trading Forex, Commodities, Indices, and other financial instruments involves a high level of risk and may not be suitable for all investors. Leverage can work against you as well as for you. You should be aware of all the risks associated with financial market trading and seek advice from an independent financial advisor if you have any doubts.
No Liability: The author accepts no liability for any loss or damage, including without limitation to, any loss of profit, which may arise directly or indirectly from use of or reliance on such information. Past performance is not indicative of future results. Trade at your own risk.