Welcome to my first official Weekly Market Outlook. As we close the book on the first trading week of 2026, the market narrative is beginning to sharpen. We are seeing classic structural alignments across the major pairs that suggest volatility is about to pick up.
My analysis for the week ahead is grounded in Elliott Wave Structure combined with Smart Money Concepts (SMC). We aren’t guessing; we are waiting for the market to show its hand. The dominant theme for this week is a potential resurgence of the US Dollar (DXY). We are tracking clear corrective structures that are maturing, signaling that the next impulsive legs are imminent.
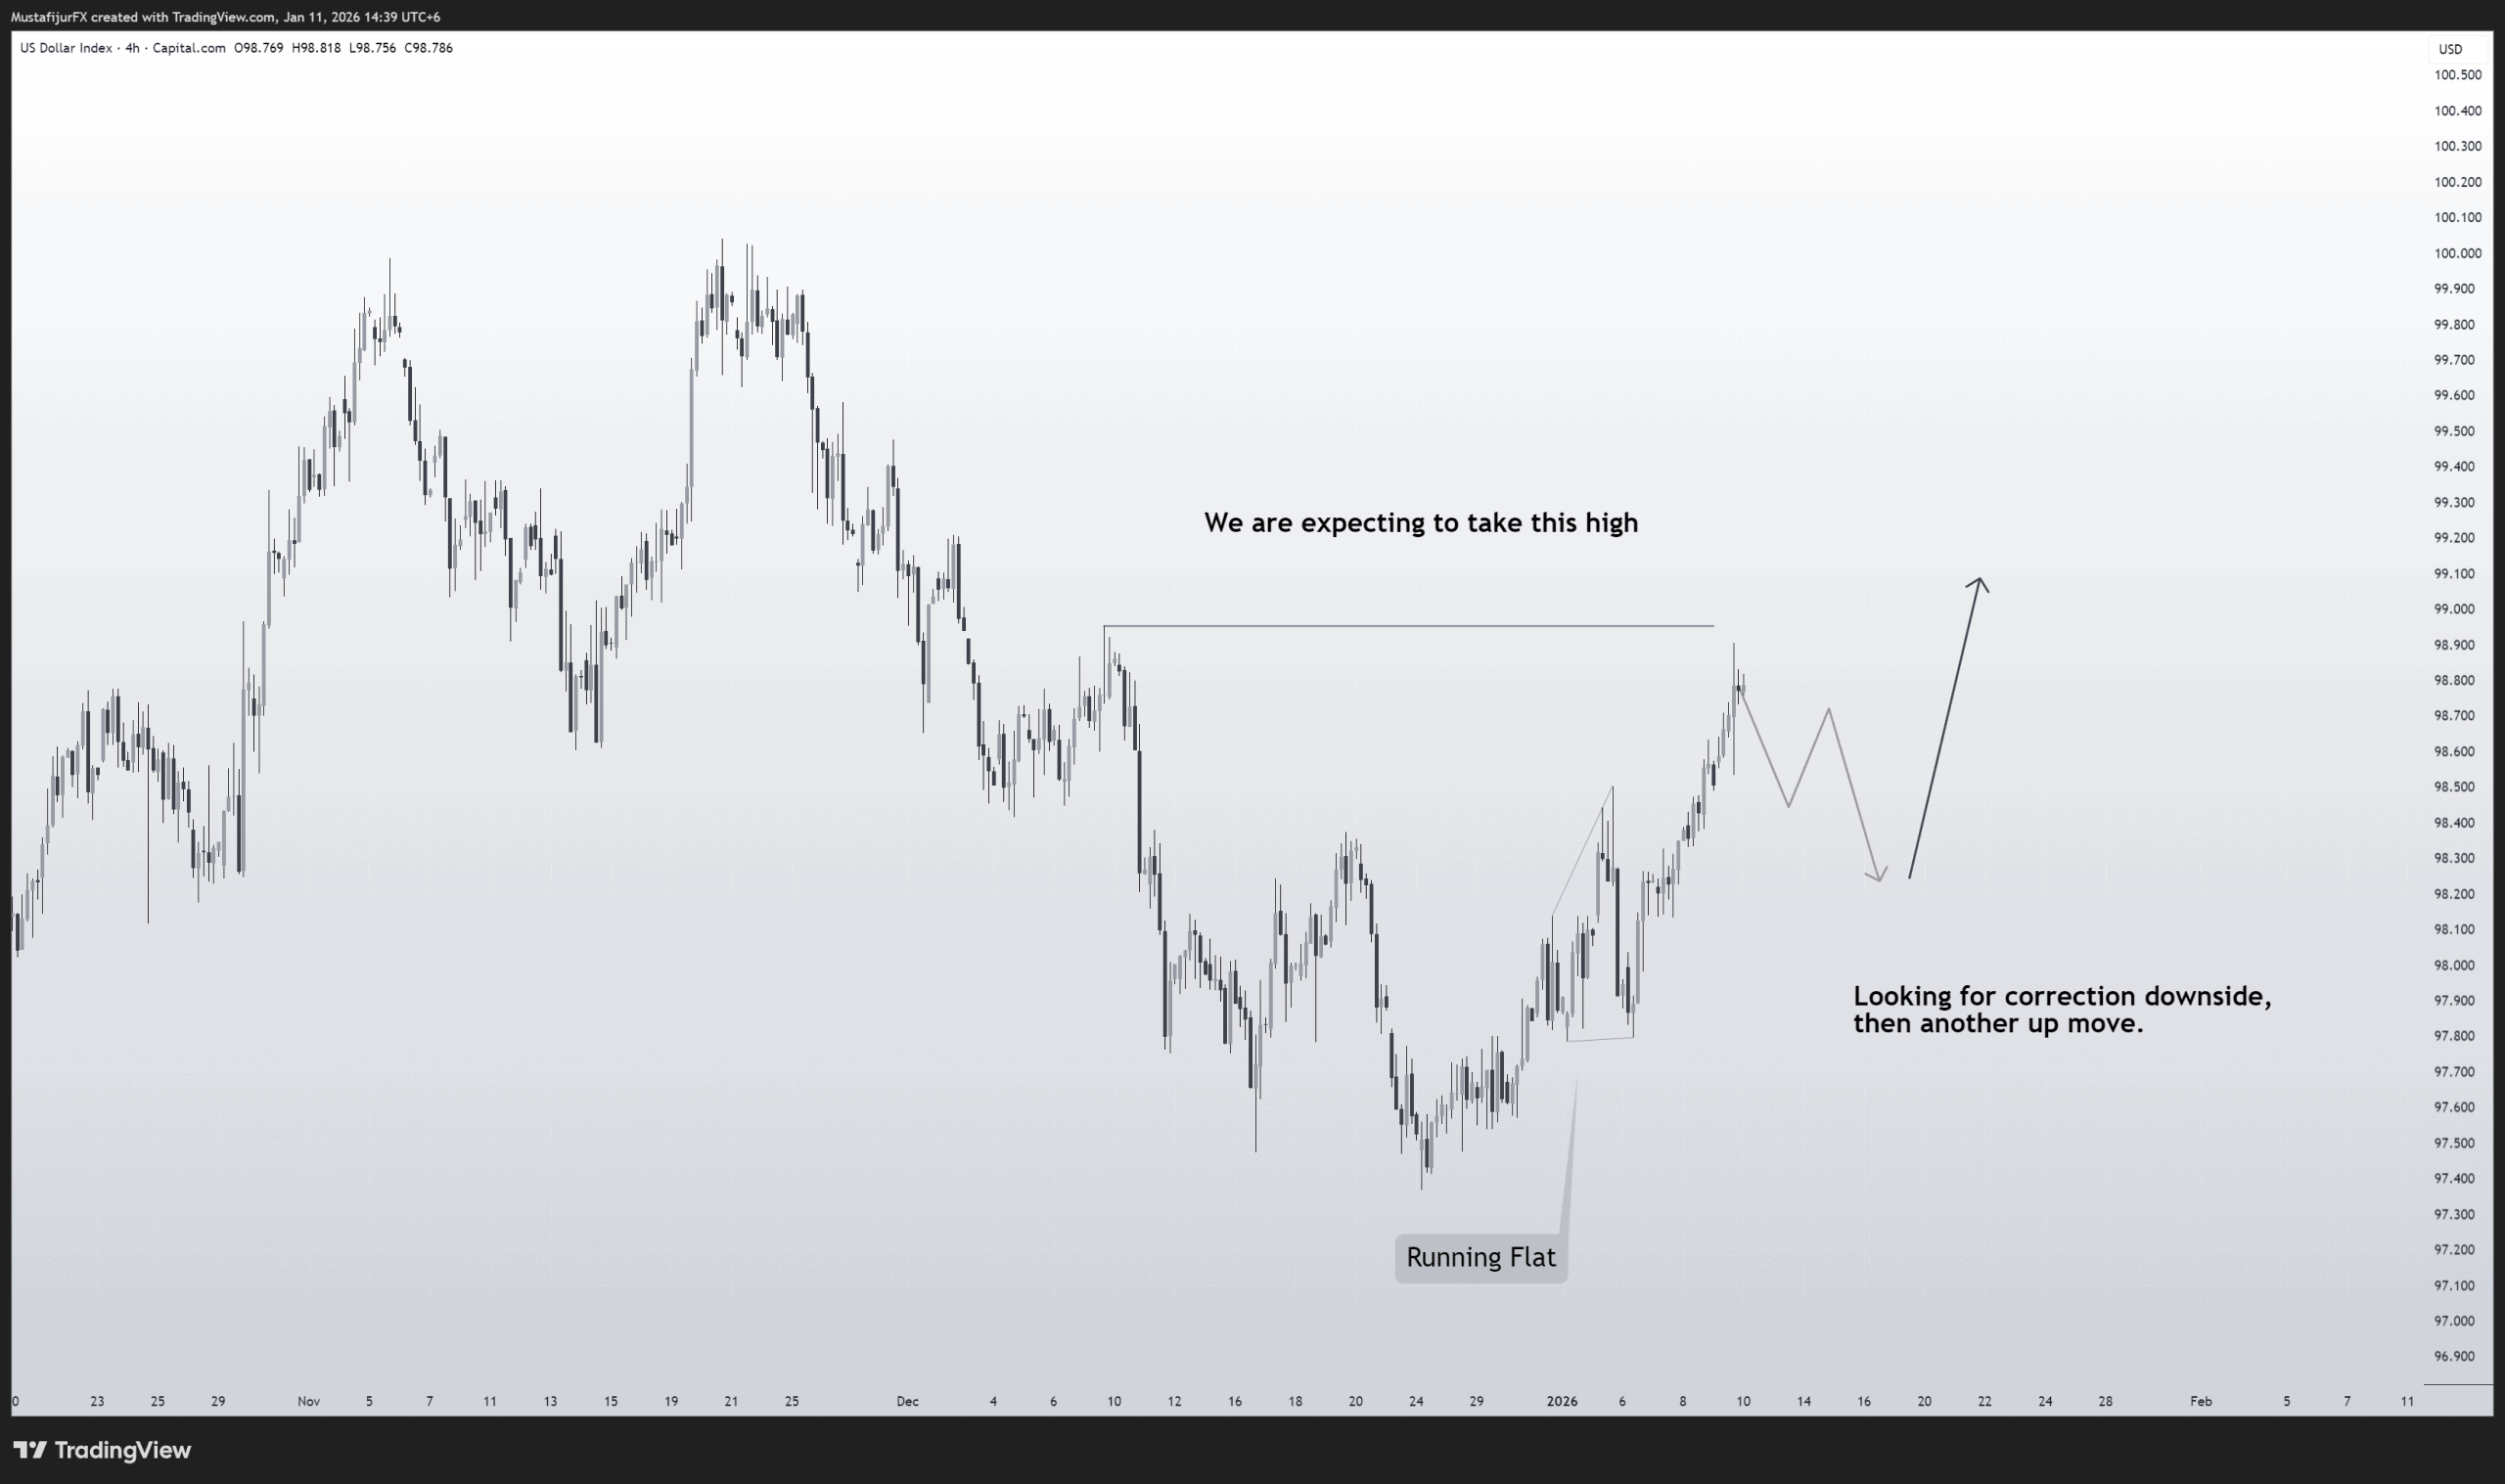
Chart Analysis performed on TradingView/Deriv. You can find my full charting setup in my Toolkit
1. US Dollar Index (DXY) – The Commander
Bias: Bullish
The Dollar Index is providing the roadmap for the entire Forex market this week. Structurally, we have identified a clean Running Flat correction. In Wave Analysis, this is a powerful continuation pattern that suggests strong underlying momentum—buyers are stepping in early, preventing price from correcting deeply.
- The Setup: We are currently finishing the internal substructure of this correction.
- The Plan: We anticipate a short-term pullback (correction downside) to induce early sellers and build liquidity. Once this correction completes, we expect an impulsive breakout to the upside.
- Target: The immediate objective is to clear the external liquidity (Highs) at 98.80+.
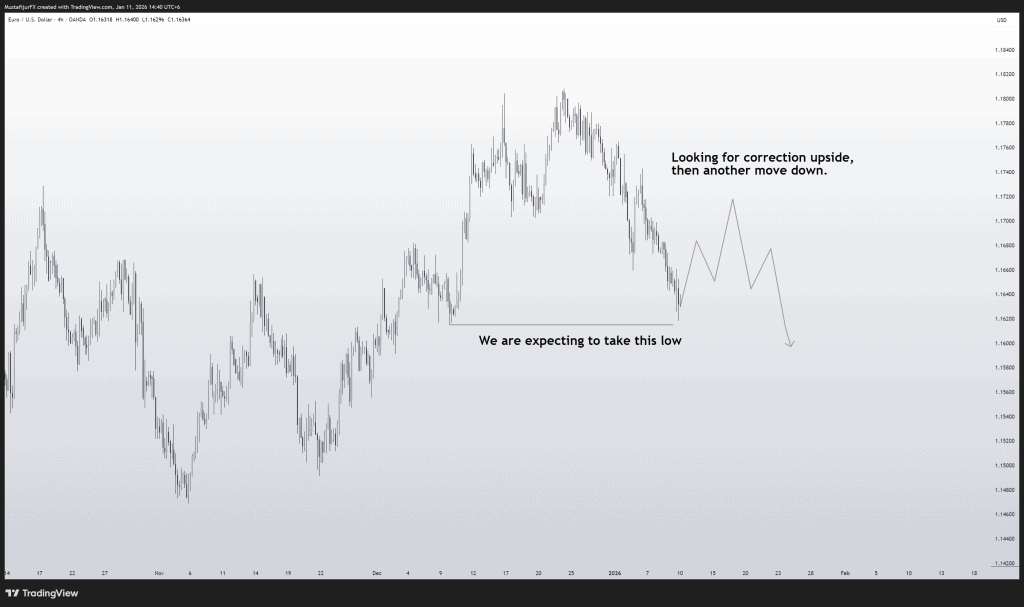
Chart Analysis performed on TradingView/Deriv. You can find my full charting setup in my Toolkit
2. EURUSD – The Mirror Image
Bias: Bearish
As expected, the Euro is mirroring the DXY’s strength with weakness. The pair has broken structure to the downside and is currently heavy. However, we do not chase price.
- The Setup: The market is poised for a corrective rally (pullback) to the upside. This relief rally is necessary to rebalance the price action and offer a “Premium” entry price.
- The Plan: We are stalking this correction into a supply zone. Once the rally exhausts, we will look for confirmation to short the next leg down.
- Target: The primary draw on liquidity is the previous structural low (marked on chart). We expect the market to sweep this level.
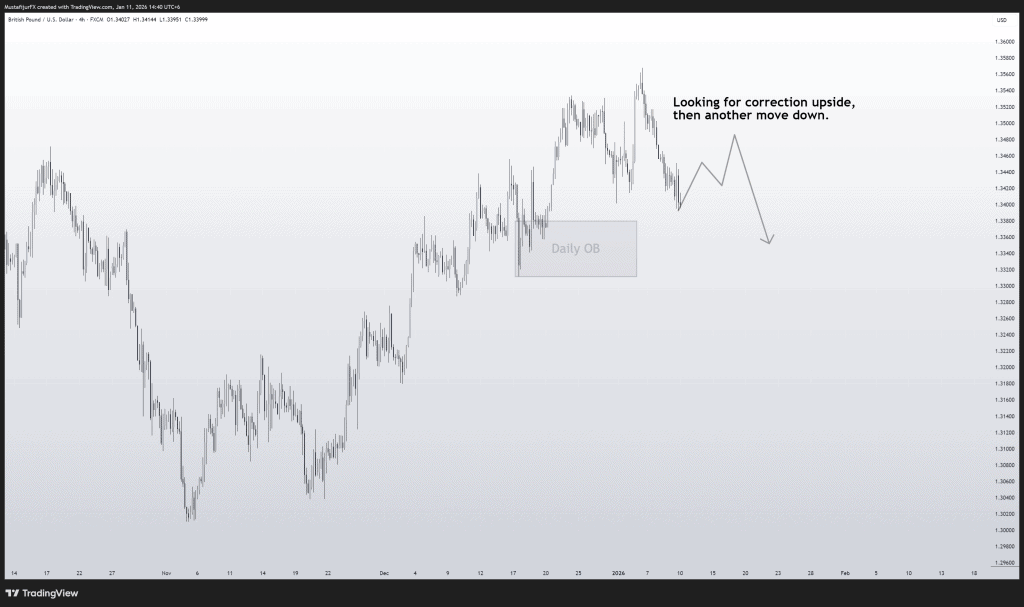
Chart Analysis performed on TradingView/Deriv. You can find my full charting setup in my Toolkit
3. GBPUSD (Cable) – The Daily Defense
Bias: Bearish
Cable is presenting a very similar structure to the Euro but with a specific area of interest. We have identified a Daily Order Block (OB) that has caused a reaction, but the bearish pressure remains dominant.
- The Setup: Price is currently reacting off the lows, and we are looking for a deeper correction upward into the equilibrium or premium zones.
- The Plan: We are patient. We need to see the price correct slowly (corrective nature) before the sellers regain control.
- Target: Just like EURUSD, we are anticipating “another move down” to attack the weak lows once the correction terminates.
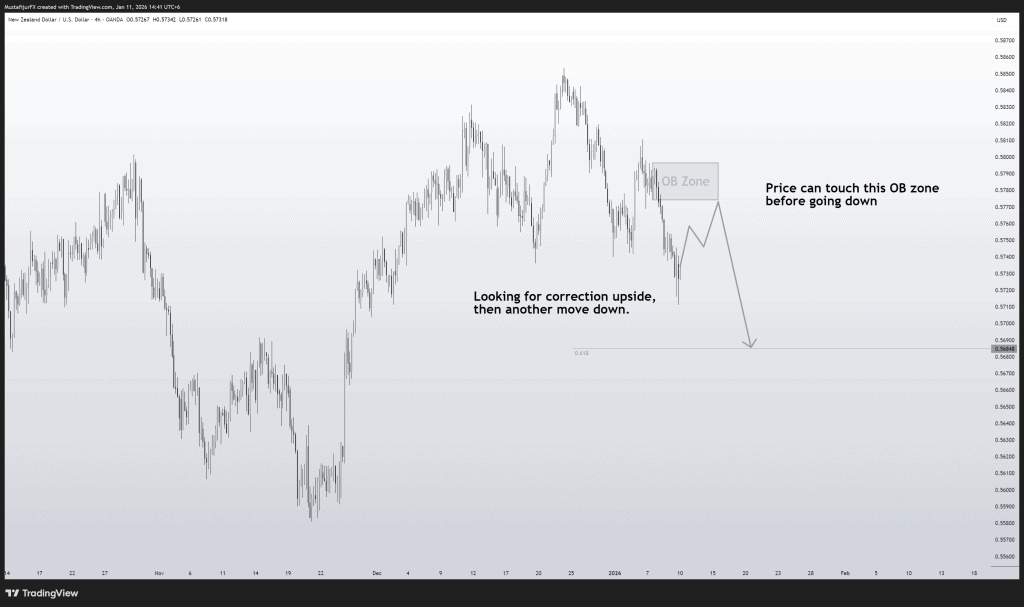
Chart Analysis performed on TradingView/Deriv. You can find my full charting setup in my Toolkit
4. NZDUSD – The Premium Trap
Bias: Bearish
Similar to the Cable (GBPUSD), the Kiwi Dollar is currently in a downtrend, but we are not chasing the lows. The market has left a clean Order Block (OB) Zone in the premium pricing area.
- The Setup: We are waiting for price to correct upward into this OB Zone. This “inducement” rally attracts early buyers who think the trend is reversing.
- The Plan: Watch for rejection inside the OB box. We need to see a clear reaction before committing to the short side.
- Target: Once the correction terminates, we anticipate an impulsive move down to clear the liquidity below 0.5640.
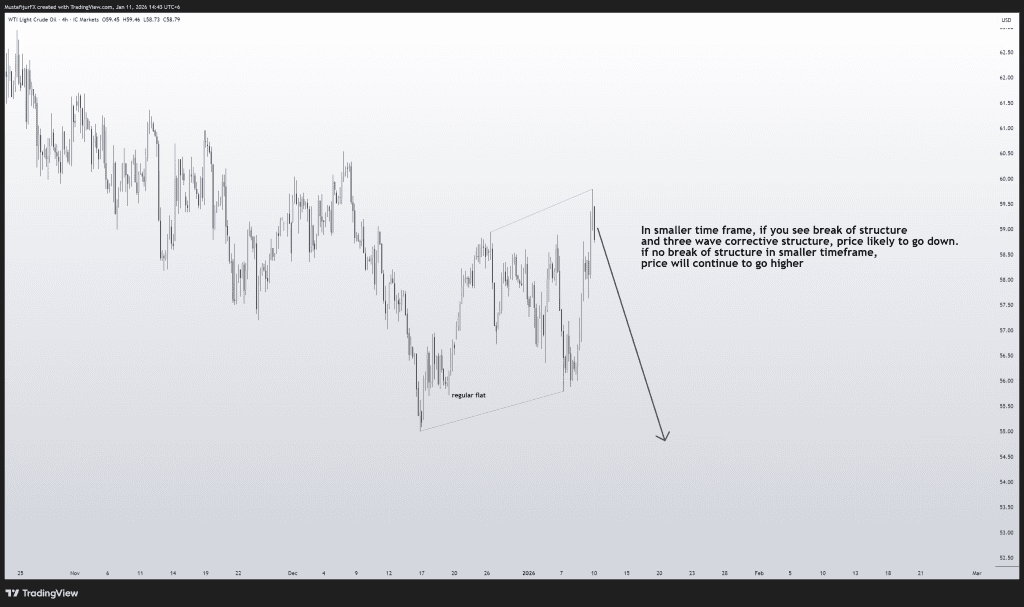
Chart Analysis performed on TradingView/Deriv. You can find my full charting setup in my Toolkit
5. WTI Crude Oil (USOIL) – The Structure Test
Bias: Bearish (Conditional)
Oil is presenting a classic Regular Flat correction on the 4H timeframe. This pattern typically signals a continuation of the trend, but patience is required here as the market decides its next leg.
- The Setup: Price is currently hovering near the top of the corrective structure.
- The Plan (The Trigger): We drop to the Lower Timeframe (LTF).
- Scenario A: If we see a confirmed Break of Structure (BOS) and a 3-wave corrective pullback, we sell the drop.
- Scenario B: If price refuses to break structure and holds above the highs, the bearish bias is invalidated, and we stand aside.
- Target: If confirmed, the target is a swift move to the downside to complete the larger wave cycle.
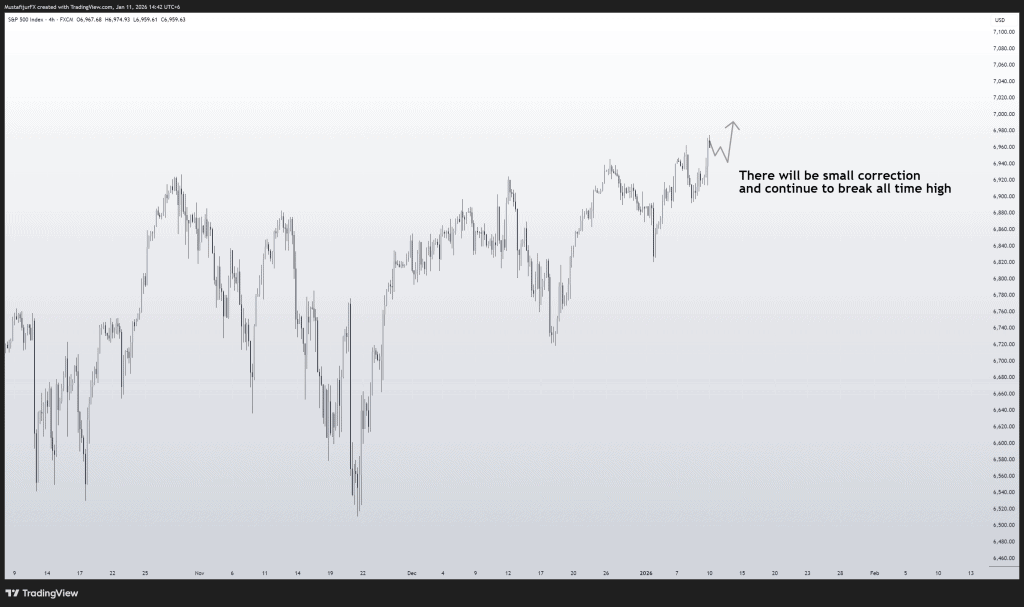
Chart Analysis performed on TradingView/Deriv. You can find my full charting setup in my Toolkit
6. S&P 500 (SPX500) – Chasing History
Bias: Bullish
The US Indices remain in a relentless structural uptrend. There is zero evidence of a reversal, so we continue to trade with the momentum.
- The Setup: We are forecasting a small, shallow correction. In strong trending markets, deep pullbacks often don’t happen because institutional demand is too high.
- The Plan: Any short-term dip is a buying opportunity. We are looking for a “micro-correction” to join the trend.
- Target: All-Time Highs. The objective is simply blue sky breakout.
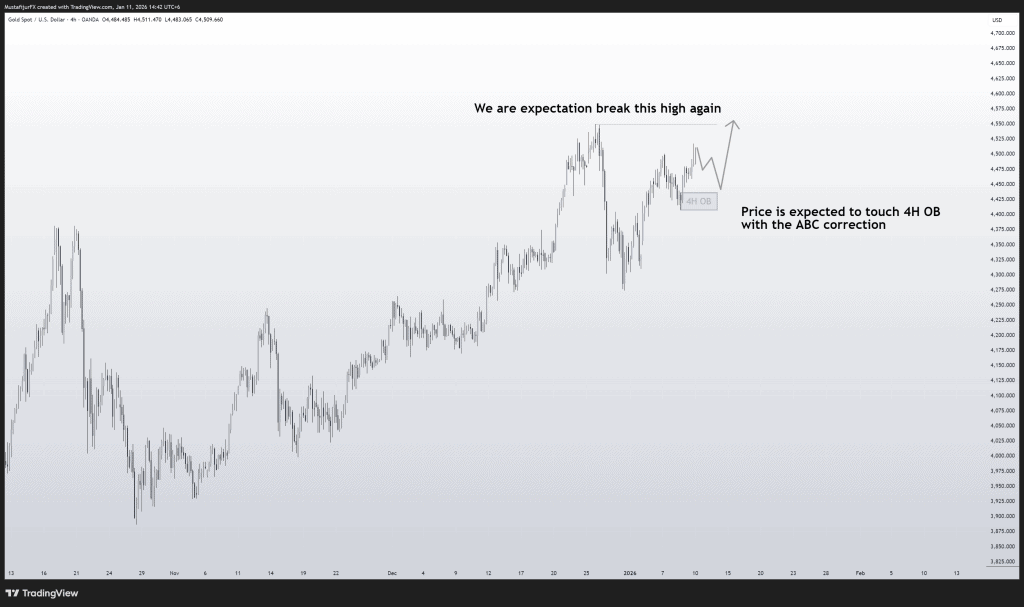
Chart Analysis performed on TradingView/Deriv. You can find my full charting setup in my Toolkit
7. Gold (XAUUSD) – The 4H Mitigation
Bias: Bullish
Gold is ignoring the broader Dollar strength and maintaining its own bullish structure. We have identified a pristine 4H Order Block that aligns with our wave count.
- The Setup: We are patiently waiting for an ABC Correction to complete. Price needs to come down to mitigate the 4H Order Block to fuel the next move.
- The Plan: We will set our alerts at the top of the OB. We want to see price tap this zone and reject it.
- Target: A break of the previous high (Liquidity Sweep). We expect Gold to attack the highs once more after this refueling stop.
DISCLAIMER: FOR EDUCATIONAL PURPOSES ONLY
The information, analysis, and charts presented in this “Weekly Market Outlook” are strictly for educational and informational purposes only. They do not constitute financial advice, investment recommendations, or a signal to buy or sell any financial instrument.
Risk Warning: Trading Forex, Commodities, Indices, and other financial instruments involves a high level of risk and may not be suitable for all investors. Leverage can work against you as well as for you. You should be aware of all the risks associated with financial market trading and seek advice from an independent financial advisor if you have any doubts.
No Liability: The author accepts no liability for any loss or damage, including without limitation to, any loss of profit, which may arise directly or indirectly from use of or reliance on such information. Past performance is not indicative of future results. Trade at your own risk.