
The Inflation Gauntlet: Trap or Reversal?
Following the NFP shockwave, the market narrative shifts this week from “Labor Weakness” to “Inflation Reality.” With the US Dollar Index (DXY) attempting a recovery, we are entering a critical “Inflation Gauntlet” that will decide if this bounce is a genuine structural shift or a classic “Dead Cat Bounce” designed to trap early bulls.
The Week Ahead:
- Tuesday (Feb 10): US Retail Sales will test the consumer strength narrative.
- Wednesday (Feb 11): The US CPI print is the “Main Event.” Expect Smart Money to manipulate price action leading up to this release.
- Thursday (Feb 12): UK GDP data will likely trigger volatility in Sterling pairs.
For SMC and Wave traders, the setup is clear: waiting for the Liquidity Sweep before the news drops is the only way to avoid the noise.
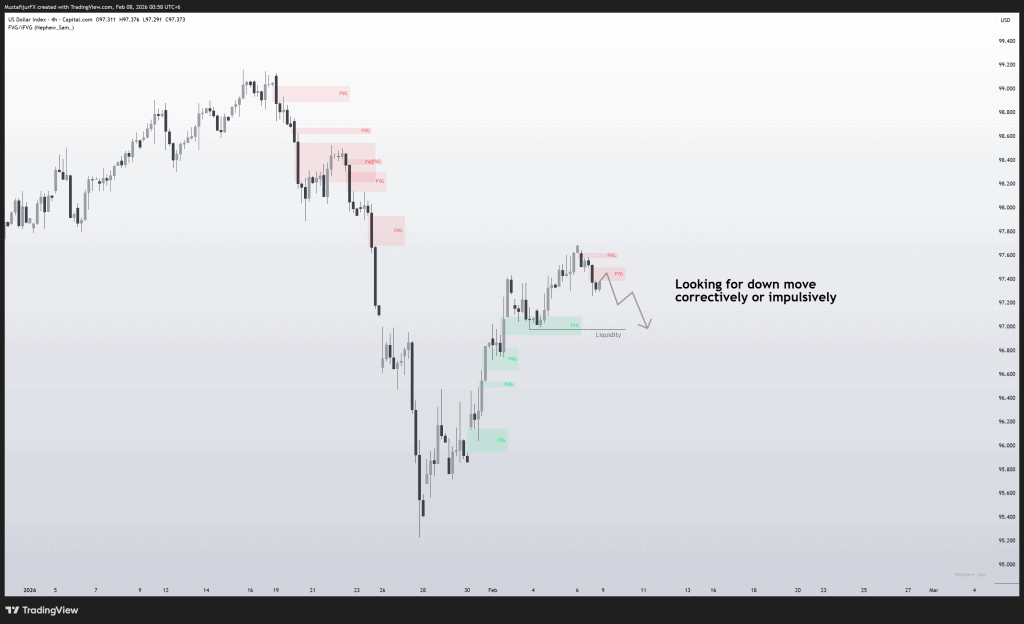
Chart Analysis performed on TradingView/Deriv. You can find my full charting setup in my Toolkit
1. DXY (US Dollar Index): The “Dead Cat” Test
The Dollar is currently testing the 98.00 psychological level, but the momentum is unconvincing.
- SMC Analysis: The recent push up looks like a Mitigation of the bearish Order Block (OB) formed in late January. We are watching the 98.20 – 98.50 zone as a potential “Bull Trap.” If price fails to close above this Supply Zone, we expect a violent rejection targeting the Sell-Side Liquidity (SSL) below 96.50.
- Wave Analysis: This move counts as a corrective Wave B (or Wave 2) within a larger bearish cycle. The internal structure suggests an A-B-C zigzag is completing. A reversal near 98.50 would confirm the start of a damaging Wave C lower.
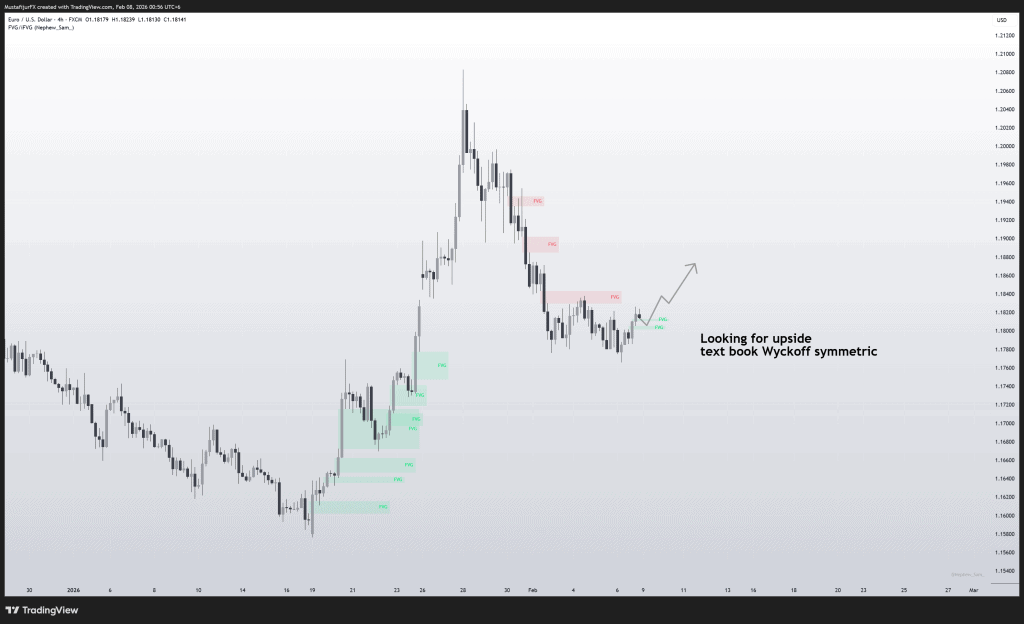
Chart Analysis performed on TradingView/Deriv. You can find my full charting setup in my Toolkit
2. EUR/USD: Defending the 1.1800 Fortress
The Euro has pulled back to the 1.1800 institutional level, a zone that has acted as a pivot for months.
- SMC Analysis: Price has tapped into a H4 Demand Zone at 1.1800 – 1.1820. We are looking for a Change of Character (CHoCH) on the 15-minute timeframe to confirm that institutions are accumulating long positions here. A failure to hold 1.1780 would invalidate this setup and expose the 1.1700 liquidity pool.
- Wave Analysis: We view this pullback as a standard Wave 4 correction. As long as the 1.1750 overlap territory holds, the primary forecast remains a bullish Wave 5 expansion targeting 1.2100+ later in the month.
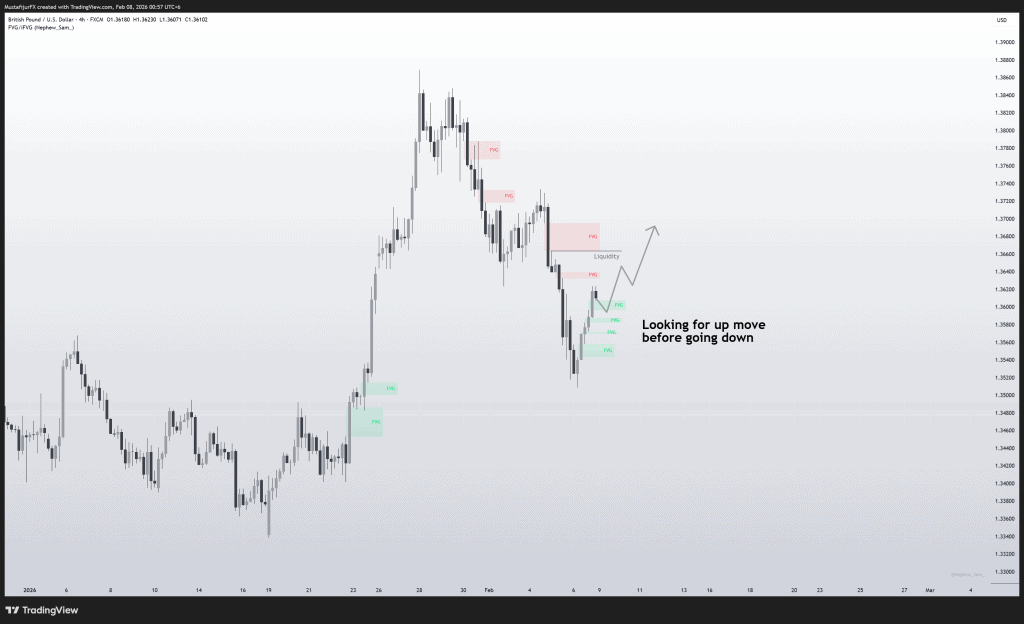
Chart Analysis performed on TradingView/Deriv. You can find my full charting setup in my Toolkit
3. GBP/USD: The Consolidation Trap
Cable is trapped in a tight range near 1.3600, consolidating after its January surge.
- SMC Analysis: The pair is building a massive “Inducement” pattern. Retail traders are being lured into early shorts, but the Buy-Side Liquidity (BSL) above 1.3750 remains untouched. We expect a “stop hunt” spike above 1.3750 (likely on UK GDP news) to grab liquidity before the real move happens.
- Wave Analysis: The structure is complex, likely a Triangle or Flat Correction (Wave 4). The 1.3550 level is the “line in the sand.” A bounce here supports a final thrust toward 1.3800 to complete the larger impulse sequence.
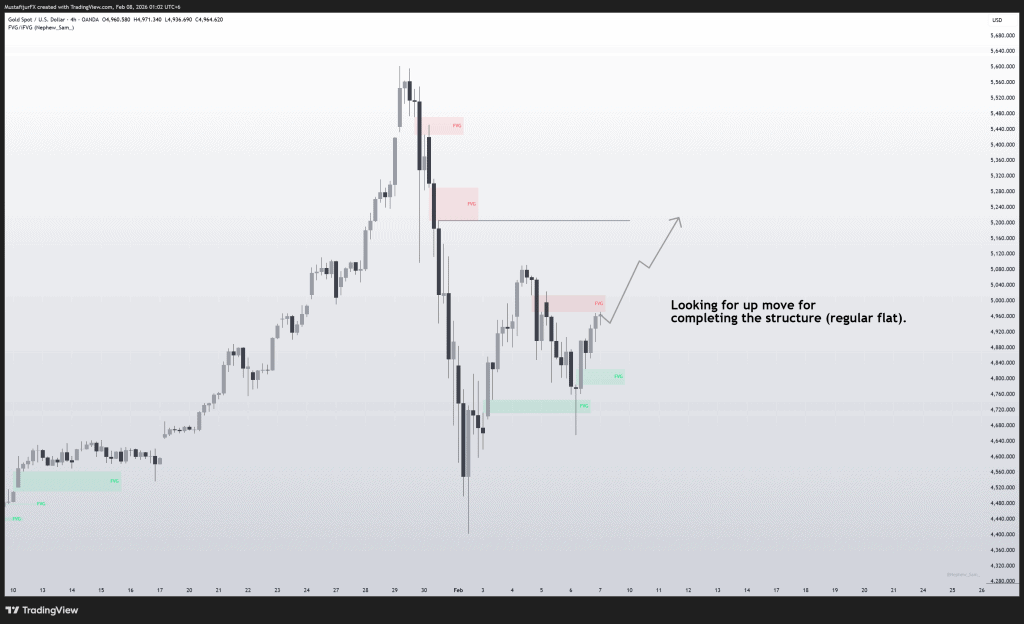
Chart Analysis performed on TradingView/Deriv. You can find my full charting setup in my Toolkit
4. Gold (XAU/USD): The “Regular Flat” Completion
Gold has been correcting aggressively, but the structure suggests this is a pause, not a reversal. The market is setting up a classic Regular Flat correction pattern.
- SMC Analysis: Price is reacting off a H4 Fair Value Gap (FVG) and Demand Zone. We are seeing early signs of accumulation. The “Smart Money” objective here is to mitigate the open orders in the discount array before pushing price back up to clear the Buy-Side Liquidity (BSL) residing above the $5,200 level.
- Wave Analysis: As noted on the chart, we are likely completing a Wave 4 “Regular Flat.” The recent drop was the C-leg of this flat. We are now positioning for the start of an impulsive Wave 5, targeting a move back toward the highs to complete the larger structure.
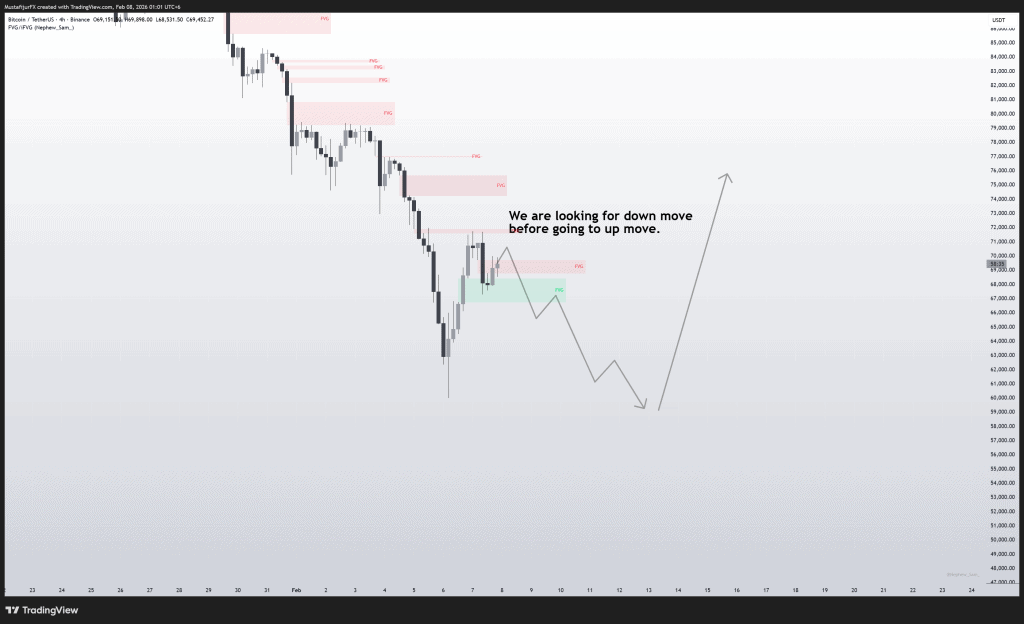
Chart Analysis performed on TradingView/Deriv. You can find my full charting setup in my Toolkit
5. BTC/USDT: One Last Flush
Bitcoin remains heavy, and the chart signals that the correction isn’t quite over. We are looking for a “Down-to-Up” sequence.
- SMC Analysis: There is significant Sell-Side Liquidity (SSL) resting below the recent consolidation lows (around $65k – $66k). The institutional play here is likely a “stop run” into the deep Discount Zone (marked by the lower green FVG around $60k-$62k). Once that liquidity is grabbed, look for a sharp rejection and a Change of Character (CHoCH) to signal the true reversal.
- Wave Analysis: We are in the final stages of a complex correction (likely a W-X-Y or A-B-C). The current leg down is the final “washout” required to reset sentiment. We need this lower low to complete the structure before the next major bullish cycle begins.
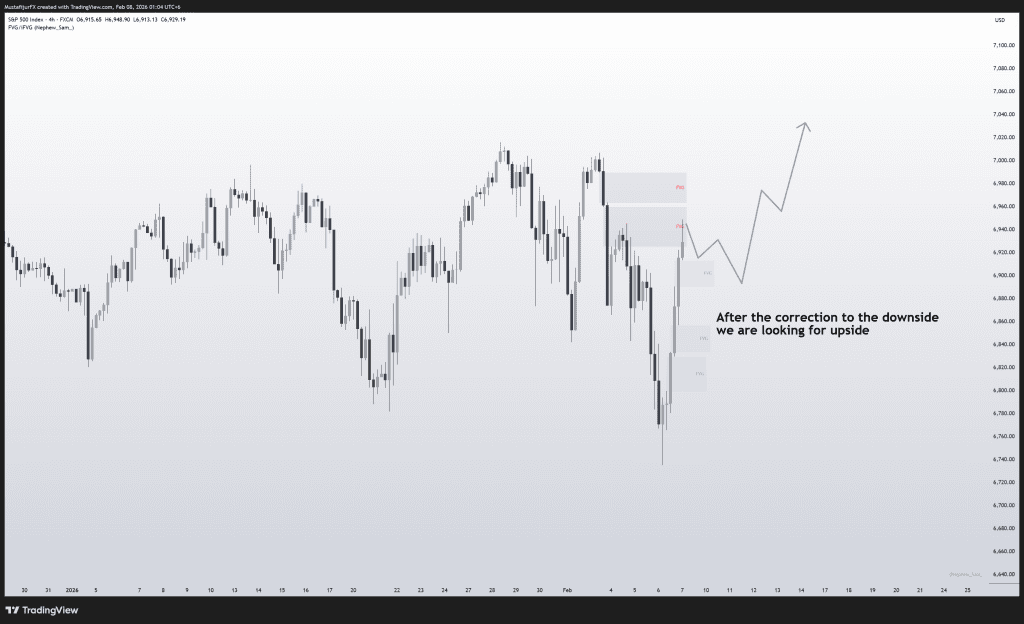
Chart Analysis performed on TradingView/Deriv. You can find my full charting setup in my Toolkit
6. SPX 500: The “Buy the Dip” Setup
The S&P 500 is offering a textbook trend continuation setup. After a healthy correction, the index is preparing for the next leg higher.
- SMC Analysis: Price is retracing into a premium Demand Zone (Green FVG). This is a high-probability area for bulls to defend. We expect price to dip into this zone to “refuel” before attacking the Equal Highs (EQH) above 7,000.
- Wave Analysis: This pullback counts clearly as a corrective wave within a strong uptrend. Once this corrective substructure is finished in the demand zone, the path of least resistance is up, targeting fresh all-time highs.
Conclusion: The “Inflation Gauntlet” Strategy
As we head into the week of February 9 – 13, the market is at a decisive pivot point. The CPI release on Wednesday will be the primary engine for volatility, likely triggering the final “liquidity flushes” we see in the charts for Bitcoin and DXY.
For the SMC trader, patience is your edge this week. Gold and SPX500 are setting up for bullish continuation after their corrections, while Bitcoin demands one final “washout” to trap eager early buyers. The DXY remains the key indicator—if it fails at the 98.20 Supply Zone, expect the “Risk-On” assets (Gold, BTC, Equities) to fly. Do not chase the initial move; wait for the liquidity sweep.
DISCLAIMER: FOR EDUCATIONAL PURPOSES ONLY
The information, analysis, and charts presented in this “Weekly Market Outlook” are strictly for educational and informational purposes only. They do not constitute financial advice, investment recommendations, or a signal to buy or sell any financial instrument.
Risk Warning: Trading Forex, Commodities, Indices, and other financial instruments involves a high level of risk and may not be suitable for all investors. Leverage can work against you as well as for you. You should be aware of all the risks associated with financial market trading and seek advice from an independent financial advisor if you have any doubts.
No Liability: The author accepts no liability for any loss or damage, including without limitation to, any loss of profit, which may arise directly or indirectly from use of or reliance on such information. Past performance is not indicative of future results. Trade at your own risk.