As we enter the first full week of February 2026, the market is navigating extreme volatility triggered by a shifting US Dollar narrative and a dense central bank calendar. For SMC and Wave practitioners, this week is about identifying where Smart Money is hunting for liquidity before the massive Non-Farm Payrolls (NFP) release on Friday.
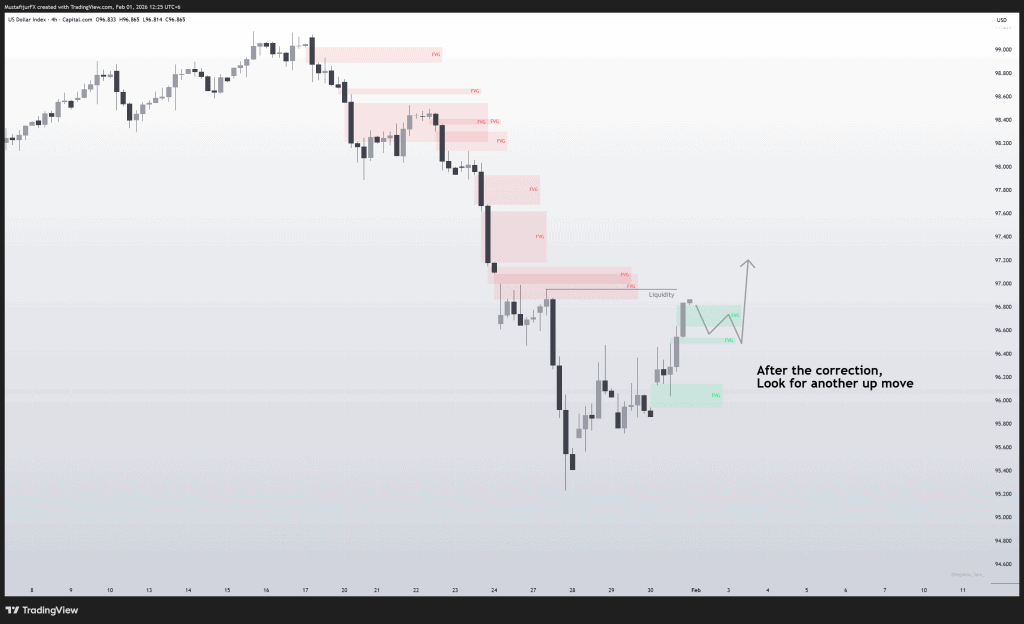
Chart Analysis performed on TradingView/Deriv. You can find my full charting setup in my Toolkit
DXY (US Dollar Index): The Bearish Flow
The US Dollar has continued its decline after a weak performance in late 2025.
- SMC Analysis: The DXY is currently grappling with a structural shift. Watch for a Liquidity Sweep of the 96.65–96.85 resistance zone. If price fails to hold this “Supply Zone,” expect a move toward the internal liquidity pools at 94.60.
- Wave Analysis: We are likely seeing a corrective move following a sharp January drop. A failure to break 97.00 would confirm the next impulsive wave lower.
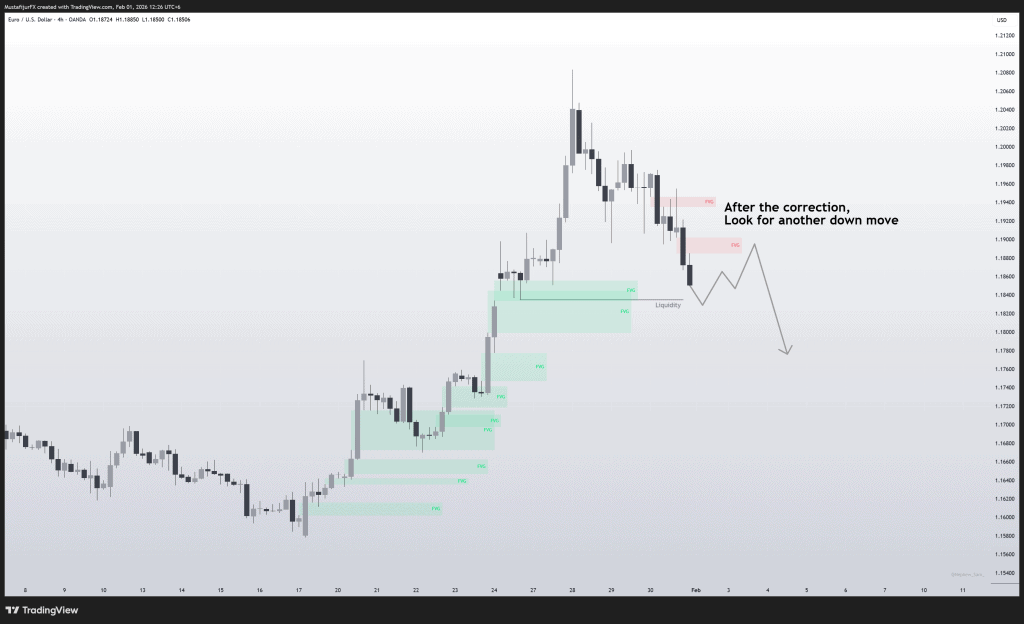
Chart Analysis performed on TradingView/Deriv. You can find my full charting setup in my Toolkit
EUR/USD: Testing the 1.2000 Barrier
EUR/USD spiked to approximately 1.2083 last week before returning toward the 1.1850 level.
- SMC Analysis: The pair recently broke out of a long-term range (1.1470–1.1830). We are now looking for a Mitigation of the “Demand Zone” near 1.1800–1.1850 before a potential continuation toward the next Buy-Side Liquidity (BSL) targets at 1.2260.
- Wave Analysis: The recent surge followed by a pullback suggests we are in a Wave 4 consolidation. A successful hold of 1.1850 could trigger the Wave 5 extension toward 1.2350.
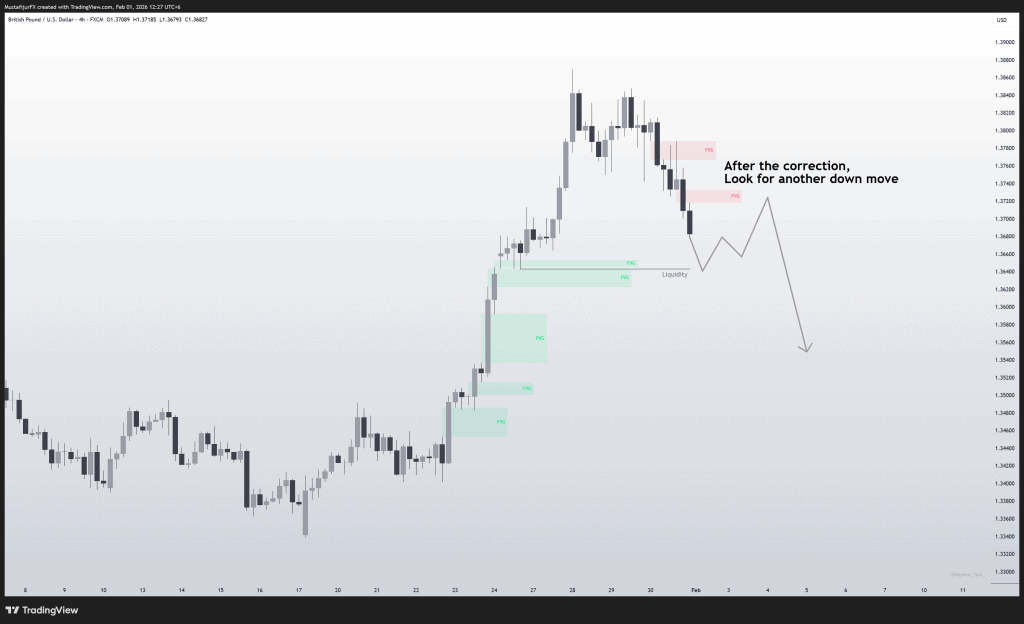
Chart Analysis performed on TradingView/Deriv. You can find my full charting setup in my Toolkit
GBP/USD & GBP/JPY: Central Bank Volatility
The Bank of England (BoE) meeting on Thursday, February 5, is the primary driver here.
- SMC Analysis: Markets expect the BoE to remain on hold at 3.75%. Look for a Liquidity Grab around the 1.2750 (GBP/USD) or 214.80 (GBP/JPY) levels during the announcement.
- Wave Analysis: For GBP/USD, price action remains sideways. A hawkish hold could spark an impulsive break of recent highs, while a dovish tone may lead to a deeper corrective C-wave toward 1.2550.
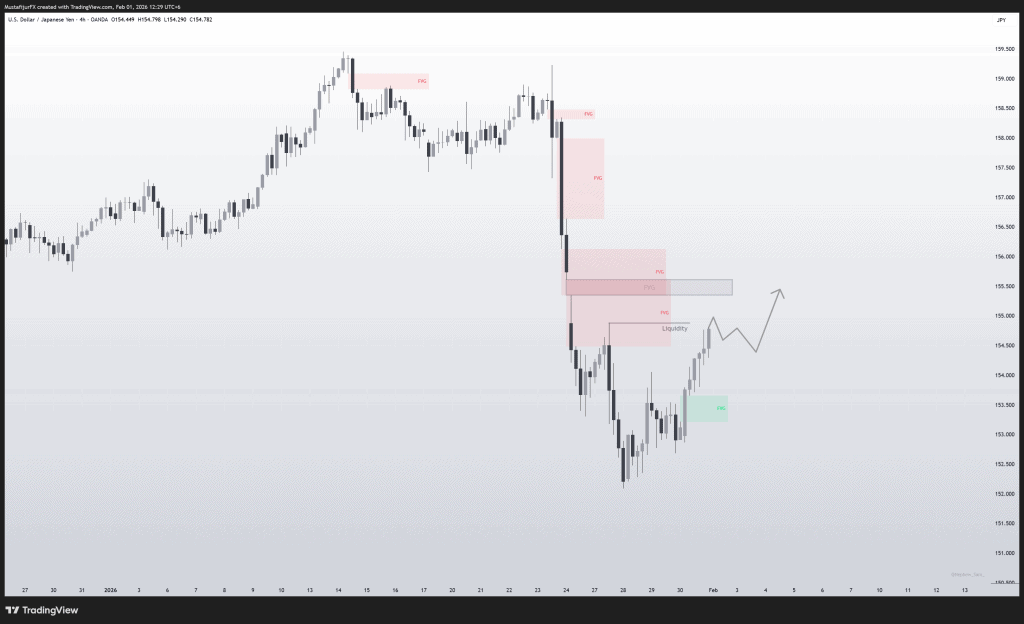
Chart Analysis performed on TradingView/Deriv. You can find my full charting setup in my Toolkit
USD/JPY: The Intervention Zone
The Pair of the Week has faced a “thunderous smack lower” after hitting highs above 159.00 in late January.
- SMC View: We are currently in a high-alert Liquidity Grab phase. Markets are spooked by coordinated “rate checks” and potential intervention rumors involving both the BoJ and US Treasury. Price is currently hovering near 153.30, which many institutions view as “oversold”.
- Wave View: The recent dive from 159.00 to 153.00 appears to be a sharp Wave A of a corrective cycle. We expect a Wave B relief rally toward the 155.00–156.60 supply zone before the final Wave C leg lower.
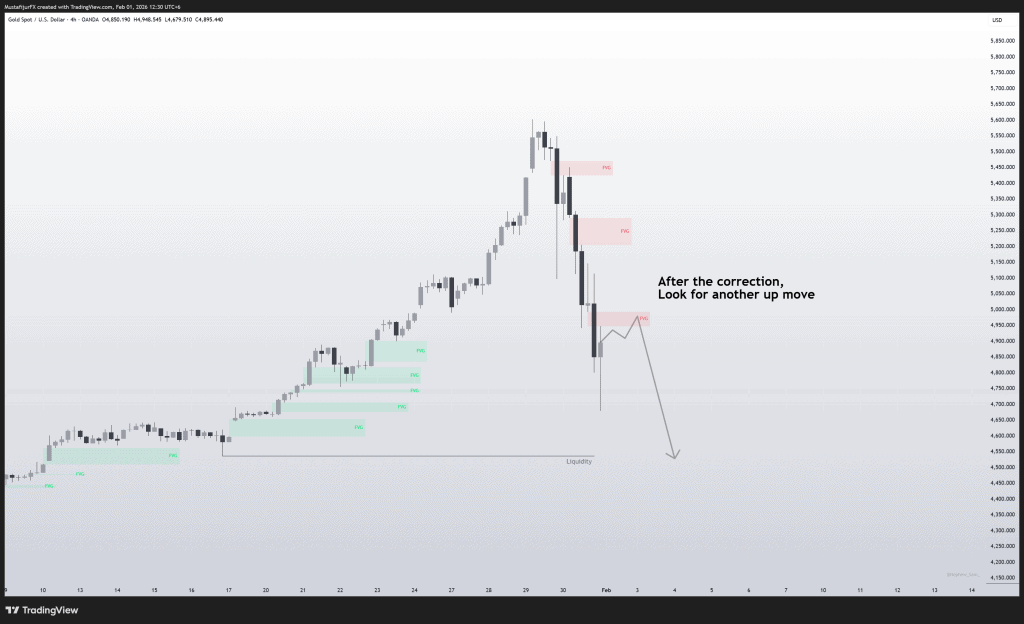
Chart Analysis performed on TradingView/Deriv. You can find my full charting setup in my Toolkit
Gold (XAU/USD): The “Flash Crash” Correction
After a meteoric 30% yearly run that saw Gold touch all-time highs near $5,600, the metal suffered its largest single-day loss on record this past Friday.
- SMC View: A massive Liquidity Sweep occurred at the highs. We are now monitoring the Major Psychological Pivot at $5,000–$5,100. A close below $5,100 could signal that the Smart Money has finished its distribution phase, putting the entire 2026 bull run at risk.
- Wave View: Technically, the “near-term high” is likely in place. We are looking for price to stabilize around the $4,780 (61.8% retracement) level to determine if the long-term Uptrend remains viable.
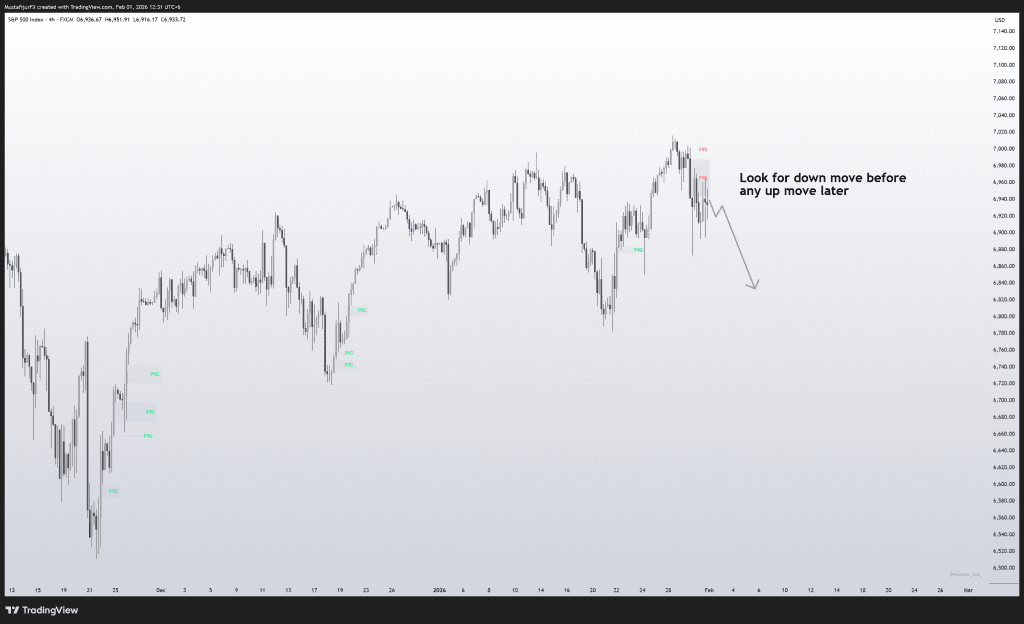
Chart Analysis performed on TradingView/Deriv. You can find my full charting setup in my Toolkit
SPX 500: Navigating the Tech-Driven Volatility
Equity markets have been heavily influenced by high-tech earnings and the broader AI-driven capex boom.
- SMC View: The S&P 500 is showing a “broadening leadership,” moving away from extreme concentration in a few tech giants. Watch the Fair Value Gaps (FVG) left by the recent Nasdaq-led surge.
- Fundamental Bias: While tech funds have performed well, broader indices are under pressure from geopolitical headlines and the “Greenland” diplomatic friction affecting USD stability.
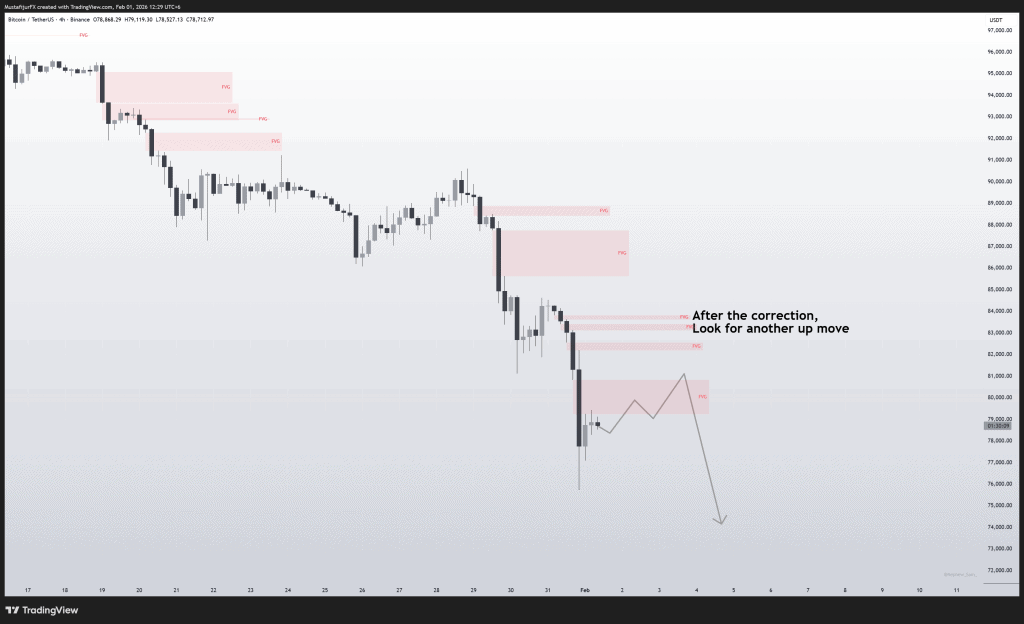
Chart Analysis performed on TradingView/Deriv. You can find my full charting setup in my Toolkit
BTC/USDT: The Breakdown Stage
Bitcoin enters February facing significant bearish pressure after a lackluster January.
- Bearish Continuation: BTC has recently broken below the lower trendline of a “bear flag,” signaling a strong bearish continuation setup.
- Liquidity Hunt: The recent breakdown has moved price through key support levels. Smart Money is likely targeting the $70,000 zone as the next major pool of “Sell-Side Liquidity”.
- Demand Zone: Look for a potential “reclamation” attempt near the $88,321 level, though bulls must first overcome resistance at $89,241 to prove strength.
- Corrective Cycle: The current price action aligns with a Wave C (corrective) impulse lower.
- Targeting the Floor: If the $70,000 downside target is reached, it could represent the completion of this corrective phase before any meaningful new bullish impulse begins.
s we enter the abbreviated trading week of February 3–6, the market is primed for significant structural realignments driven by a weakening US Dollar and high-stakes central bank liquidity. With the DXY showing clear bearish flow and Bitcoin threatening a deeper breakdown toward $70k, the institutional bias favors patience—waiting for price to mitigate key “Discount” zones rather than chasing initial moves. Traders should treat the BoE rate decision and Friday’s NFP as the primary volatility engines, looking for liquidity sweeps on Gold and Majors to confirm the next valid Wave impulses before committing capital in this highly reactive environment.
DISCLAIMER: FOR EDUCATIONAL PURPOSES ONLY
The information, analysis, and charts presented in this “Weekly Market Outlook” are strictly for educational and informational purposes only. They do not constitute financial advice, investment recommendations, or a signal to buy or sell any financial instrument.
Risk Warning: Trading Forex, Commodities, Indices, and other financial instruments involves a high level of risk and may not be suitable for all investors. Leverage can work against you as well as for you. You should be aware of all the risks associated with financial market trading and seek advice from an independent financial advisor if you have any doubts.
No Liability: The author accepts no liability for any loss or damage, including without limitation to, any loss of profit, which may arise directly or indirectly from use of or reliance on such information. Past performance is not indicative of future results. Trade at your own risk.